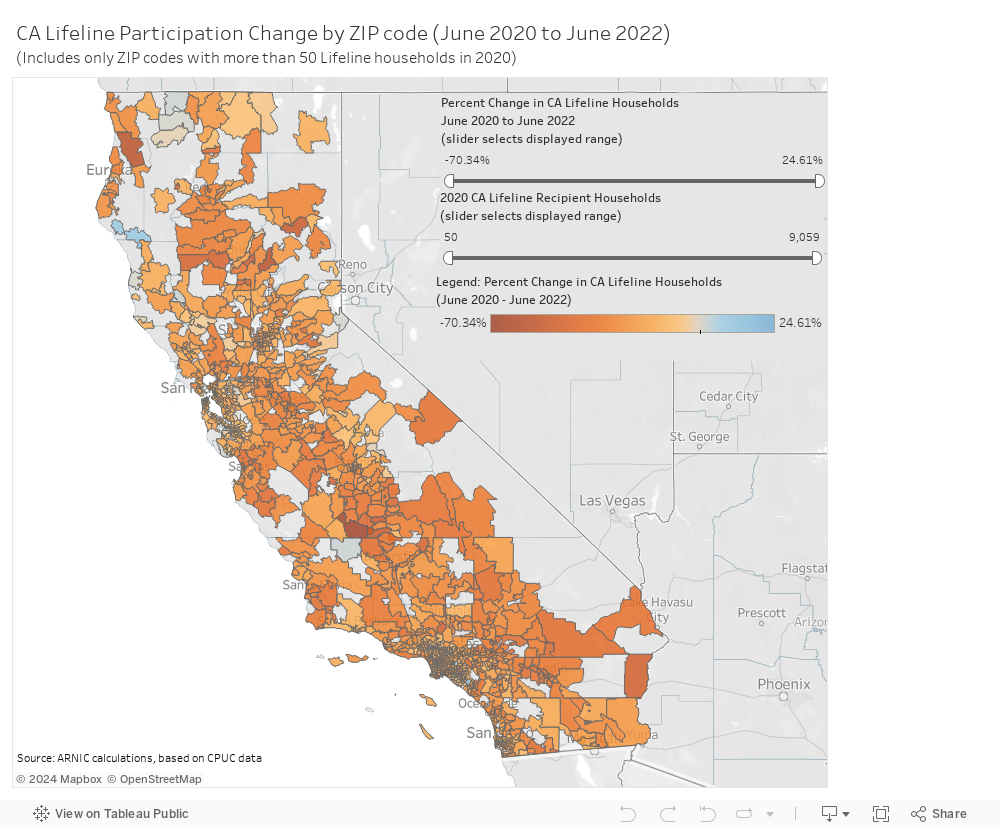
Percent Change in California Lifeline Households (2020-2022), by zipcode
Where did CA Lifeline participation drop during the pandemic, and why?
The California Lifeline program provides a $16.23/month subsidy to help eligible households cover the cost of their phone and internet connection, in addition to the $9.25/month Federal Lifeline subsidy. The combined $25.48/month subsidy can be applied toward a wireline broadband subscription (e.g. DSL, cable or fiber service) or to a wireless subscription (mobile phone with a data plan).
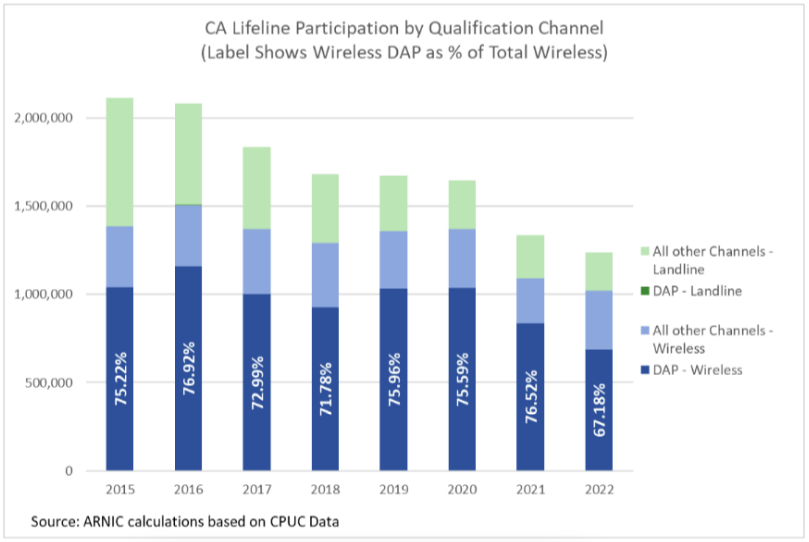
We would have expected this subsidy to become more essential during the COVID-19 pandemic, as remote schooling and remote work made internet connections indispensable. Paradoxically, participation in the California Lifeline declined by 25% between June 2020 and June 2022, dropping from 1.64 million households in mid-2020 to 1.24 million households in mid-2022. Equally surprising, the drop mostly came from decline in wireless participation, which had remained largely stable since it was introduced in 2014.
This interactive map shows the percentage change in CA Lifeline participation by ZIP code between June 2020 and June 2022. Mousing over each ZIP code will bring up a call-out box showing details for that ZIP code. The range selector restricts the display to a specific range of percent change values – e.g. to show only the ZIP codes where participation declined, or only those where participation declined by more than a certain percentage. One can see for example that most of the ZIP codes counting over 2,000 Lifeline households in 2020 are in California’s Central Valley, and the majority experienced a participation drop greater than 20%.
As we search for explanations of this paradox, we first note that in recent years most Lifeline recipients have elected to apply the subsidy to wireless service rather than landline. Digging further, we find that over the years, three quarters of wireless lifeline recipients’ applications were processed via the Direct Application Process (DAP). Between June 2021 and June 2022, that percentage dropped suddenly to 67%. According to a recent report from Sacramento State University, “DAP enrollment is currently almost exclusively utilized by Street Teams.” – Street Teams are the kiosks and pop-up tents most often set up “outside benefits offices or county buildings in which potentially eligible customers receive a variety of other social services.”
It seems likely that many of these Street Teams had to close during the pandemic, which might explain the observed participation drop. In the coming months, we plan to explore that hypothesis further, to understand whether changes in Lifeline enrollment procedures might be warranted.