Evaluating the Impact of the Affordable Connectivity Program (ACP)
Did ACP have a measurable impact on broadband access? Did the program help connect low-income families that otherwise would not have been connected? As the ACP program winds down, these questions become ever more important for policymakers and policy advocates. In this study, we offer preliminary evidence that ACP in fact helped increase broadband adoption above and beyond what one would expect had the program not been launched in early 2022.
The challenge involved in evaluating policy interventions such as ACP is well understood, and involves identifying a suitable counterfactual. In other words, what would have happened to broadband adoption among low-income households without ACP? We address this challenge by identifying low-income areas (counties) where the vast majority of households are eligible to receive ACP benefits, but where the impact of ACP is expected to be limited due to supply-side constraints.
Here is a helpful analogy: suppose the federal government launched a program that offered vouchers to low-income households to buy fresh fruits and vegetables. Such a program would be of very limited benefit for those living in “food deserts,” given the lack of fresh fruits and vegetables at local stores [1]. This illustrates the logic that underlies our evaluation of ACP. The program offered a discount on broadband to eligible low-income households, and was therefore premised on the availability of high-speed Internet access services in low-income areas. However, and aside from the well-documented limitations of the FCC maps, research shows that certain areas (mostly urban and high-income) are significantly better served by broadband providers than others.
By matching service deployment data from the FCC with demographic data from the ACS (American Community Survey), we identify low-income areas where the impact of ACP can be expected to be minimal simply because eligible households in these areas have few or no service providers to choose from. Continuing the analogy, these underserved areas are similar to food deserts, and serve as “control” units to create an empirical counterfactual to other low-income areas where ACP-supported services are readily available (the “treated” units).
To identify these underserved low-income areas (our control units), we use two thresholds: a median household income at or below $50K/year and fewer than 51% of locations serviced by fixed broadband. Both thresholds are necessary approximations, and we test the sensitivity of results to other thresholds. We show how these thresholds offer a reasonable compromise between precision (in terms of capturing ACP-eligible households in areas where fixed broadband is lacking) and sample size.
Based on these parameters, just over 100 U.S. counties fall under our definition of underserved, low-income areas. As shown in the interactive map below, while these counties are scattered across the U.S., there is a sizeable concentration in the Southeast region (the map allows for testing how different thresholds affect the geographical distribution of counties flagged as underserved). In addition, we offer a scatterplot tool that shows the bivariate correlation between median household income and fixed broadband availability.
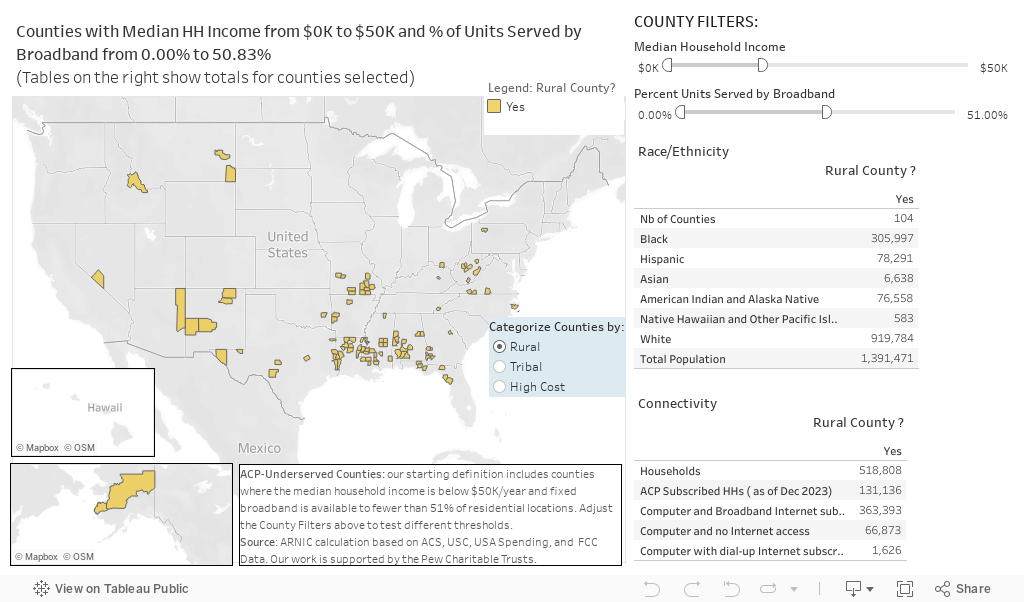
Figure 1: United States counties within a given range of median household income and fixed broadband service availability.
To evaluate the impact of ACP we use a statistical technique called difference-in-difference (DiD) which is common in program evaluation studies. At the core of our DiD impact estimates is a comparison in the change in broadband adoption between well-served and underserved low-income counties before and after the introduction of ACP in 2022. This allows for isolating the contribution that ACP has had over and above the growth in broadband adoption that would have occurred naturally – in other words, in the absence of the ACP program.
The figure below, which plots broadband and PC adoption over time in well-served and underserved counties, illustrates the logic behind our DiD analysis [2]. It shows adoption growing at a brisk pace in both groups of counties between 2019 and 2021 (that is, before the start of ACP), a growth that can be attributed to pandemic-relief initiatives such as the Emergency Broadband Benefit (EBB), three rounds of direct cash assistance (“stimulus checks”) and low-cost broadband initiatives by service providers. The green dashed line illustrates the underlying logic of DiD by representing the unobserved counterfactual – that is, what would have happened to broadband adoption in well-served counties had ACP not been launched in January 2022.
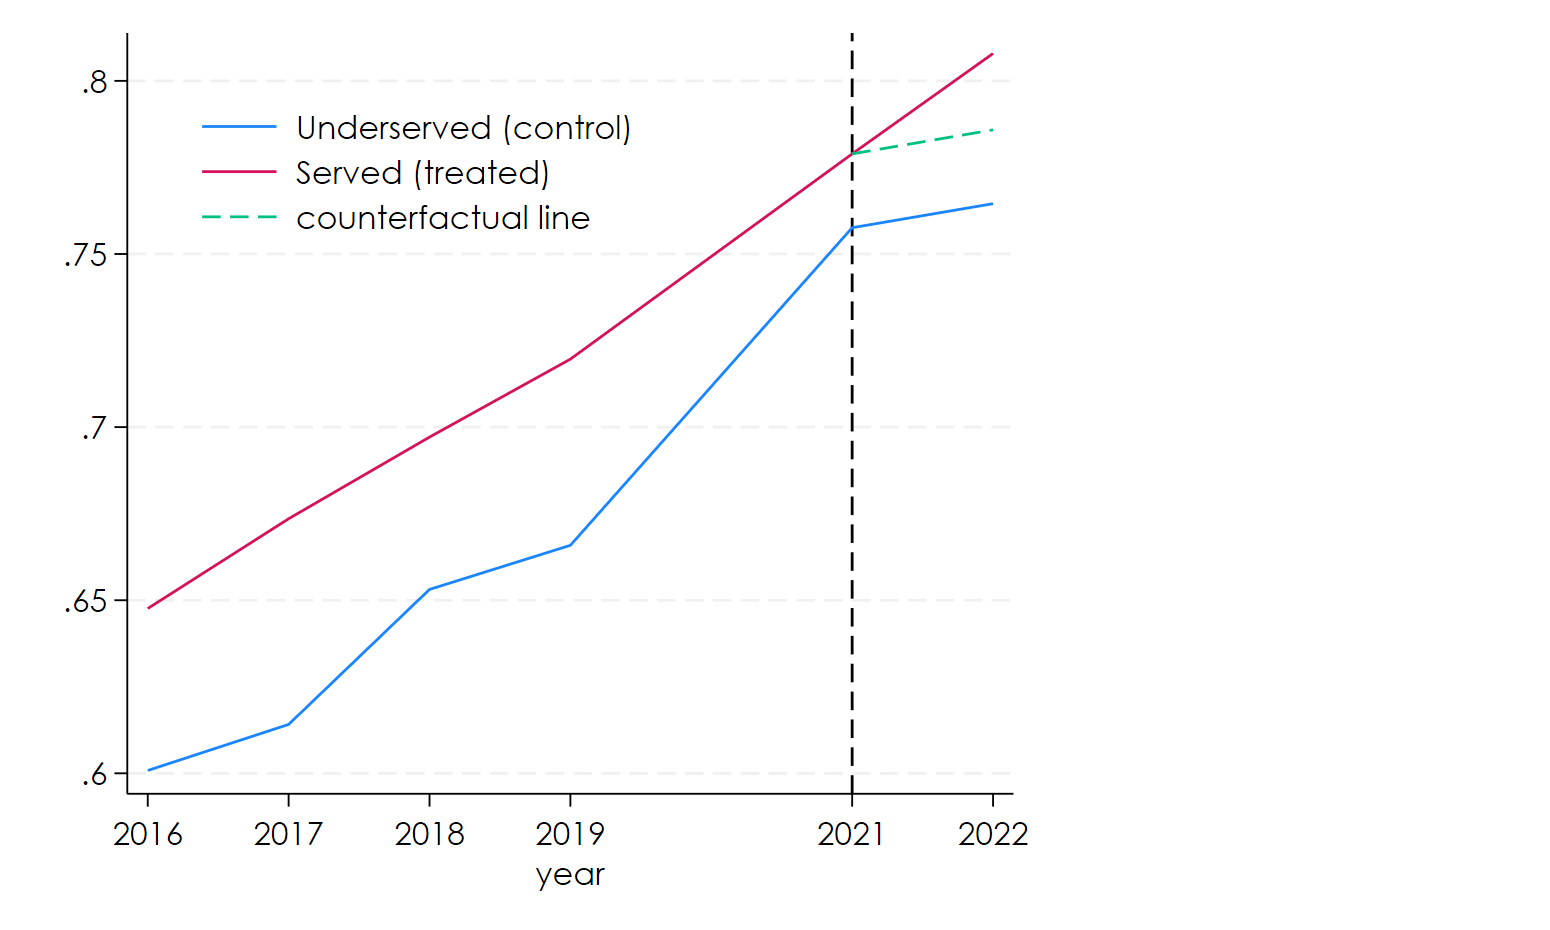
Figure 2: Broadband + PC adoption in well-served and underserved low-income counties (observed means), 2016-2022 (source: ACS 1-year estimates).
Our DiD results suggest that ACP is associated with an increase of about 6 percentage points in broadband and PC adoption in low-income counties adequately served by fixed broadband, relative to underserved counties. This represents an increase of about 7% relative to the average adoption level in well-served counties in 2021, the period immediately before the launch of ACP. It is important to note that because of the relatively small sample of low-income counties for which ACS 1-year data is available (n=237) and the limitations in the data (particularly the fact that only a single post-treatment period is available), results are statistically significant at lower confidence levels than usual (p<0.1), and therefore must be interpreted as indicative.
We perform two robustness checks to validate the results: the first is an event study specification in which the main finding is evaluated in each pre and post treatment period separately, and the second replicates the strategy used by Zuo (2021) to evaluate Comcast’s affordable Internet program. While there are differences in effect magnitudes that deserve further examination, both checks generally validate the key finding that ACP has had a positive impact on adoption among eligible households.
A key takeaway from this study is the complementarity between consumer support programs such as ACP and supply-side programs such as BEAD. Without adequate service availability and robust competition on price and quality, the impact of demand-side support programs for home broadband is severely limited. At the same time, without ACP support many middle and low-income families are likely to find the services offered by BEAD recipients unaffordable, threatening their economic sustainability. This is why programs like ACP will be necessary in the foreseeable future, and why the expiration of the ACP benefit is likely to have ripple effects across digital equity efforts at the federal, state and local levels.
Full study link: https://arnicusc.org/publications/evaluating-the-impact-of-the-affordable-connectivity-program
[1] These programs in fact exist. For example, the CalFresh Fruit and Vegetable Pilot Project offers a refund of up to $60/month to food assistance recipients when benefits are used to buy fresh fruits and vegetables. A similar benefit also exists for California WIC (Women, Infants & Children) recipients.
[2] Due to the COVID-19 pandemic, ACS 1-year estimates for 2020 are not available.