BEAD Program Targeting: A preliminary analysis
The BEAD program is the flagship initiative of the Infrastructure Investment and Jobs Act (IIJA) to address inequalities in broadband access. Administered by the National Telecommunications and Information Administration (NTIA), the program provides $42.45 billion to states and U.S. territories to expand high-speed Internet, primarily through direct grants to service operators. Congress established that the program must prioritize the deployment of broadband to unserved locations (defined as those without any broadband service or with service at speeds below 25/3Mbps), followed by deployment in underserved locations (defined as those without service at minimum speeds of 100/20 Mbps). Further, the statute provides that states must give priority to projects in “persistent poverty counties or high-poverty areas” (Infrastructure Investment and Jobs Act of 2021, 42 U.S.C. §60102, 135 Stat. 429, 1183).
This policy brief offers a preliminary analysis of targeting for the BEAD program.[1] Appropriate targeting is a key success factor in policy programs, seeking to maximize program impact by directing resources to areas and populations in most need. Our analysis builds on a dataset that matches the locations designated by states as eligible to receive BEAD funding with demographic variables, including household income and broadband adoption.[2] The goal is to examine whether BEAD state plans are directing resources to the areas and populations in most need of support for broadband connectivity. The analysis seeks to inform policymakers and advocacy organizations at a pivotal time, as state broadband offices begin to evaluate proposals and allocate BEAD funding.
An important methods caveat relates to the mismatch in geographical resolution between broadband availability and demographic data. While broadband availability and (advertised) service speeds can be observed at the location level (essentially a postal address), demographic characteristics are only available at the census block group level.[3] To address this mismatch, we first aggregate BEAD-eligible locations listed by states in BEAD plans submitted to the NTIA to the block group level. Second, for each census block group we calculate the fraction of BEAD-eligible locations relative to the total broadband-serviceable locations (BSLs).[4]
The final step involves identifying block groups that are likely to receive BEAD funding by choosing an appropriate threshold of BEAD-eligible locations relative to total BSLs. About 41% of U.S. census block groups include at least one BEAD-eligible location. However, in most cases eligible locations represent a small fraction of all BSLs in the block group. This means that the demographic characteristics observed at the block group level will in most cases not correspond to those of individual BEAD-eligible locations. At the same time, the number of block groups in which all locations are BEAD-eligible is negligible (0.04%). The analysis thus necessitates a threshold of eligible locations per block group that balances sample size with the precision of demographic data.
We choose to analyze block groups where at least half of the BSLs have been designated by states as BEAD eligible. These correspond to areas with a high concentration of unserved or underserved locations that can be expected to be prioritized in the allocation of BEAD funding, and for which demographic data better matches the true characteristics of individual BEAD-eligible locations. Using 50% as our threshold yields 6,943 census block groups (about 3% of all block groups in the U.S.) for which demographic characteristics are observed. These block groups include about 3 million BSLs, or about half (46%) of the approximately 6.4 million locations designated by states as BEAD-eligible. The analysis that follows thus focuses on these high-need areas. For convenience, we hereinafter refer to these block groups as “BEAD clusters.” For more discussion on the threshold selection, see Annex here.
A first approximation to the demographic characteristics of BEAD clusters
BEAD clusters are home to approximately 7.6 million residents (or about 2.3% of the U.S. population) living in about 2.8 million housing units. As expected, these block groups and their populations are not uniformly distributed across states. While in Louisiana and Montana they comprise about 16% of the population, in over half of states they are home to less than 2% of residents (Figure 1). This illustrates ample variation in the share of the population that is likely to impacted by BEAD across states.
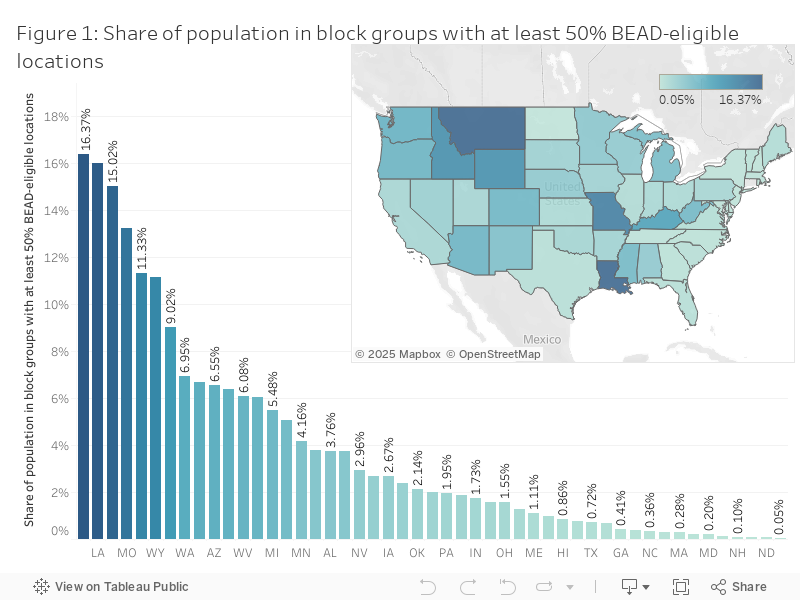
Source: FCC and Census Bureau.
A key demographic characteristic of BEAD clusters is low population density: the average density across these block groups is ~300 people per square mile (PPSM), compared to approximately 6,500 PPSM in other block groups. It is worth noting this figure is lower than the 500 PPSM threshold used by the Census Bureau to distinguish urban from rural areas. In total, approximately 93% of BEAD clusters fall below the 500 PPSM threshold. This suggests that the impacts of the BEAD program are likely to be very limited in urbanized areas and large population centers.
There are nonetheless broad variations in the average population density of BEAD clusters across states (Figure 2). These figures depend on the average population density in each state as well as the selection of eligible BEAD locations in state plans. For example, Texas ranks 26th in population density among U.S. states, but the PPSM in BEAD clusters (1,050 PPSM) is almost 20 times higher than in Missouri (57 PPSM) which ranks just below at 30th in average population density.[5] This indicates that challenges to the long-term economic viability of network operators, which is heavily dependent on population density, will be very different across states.
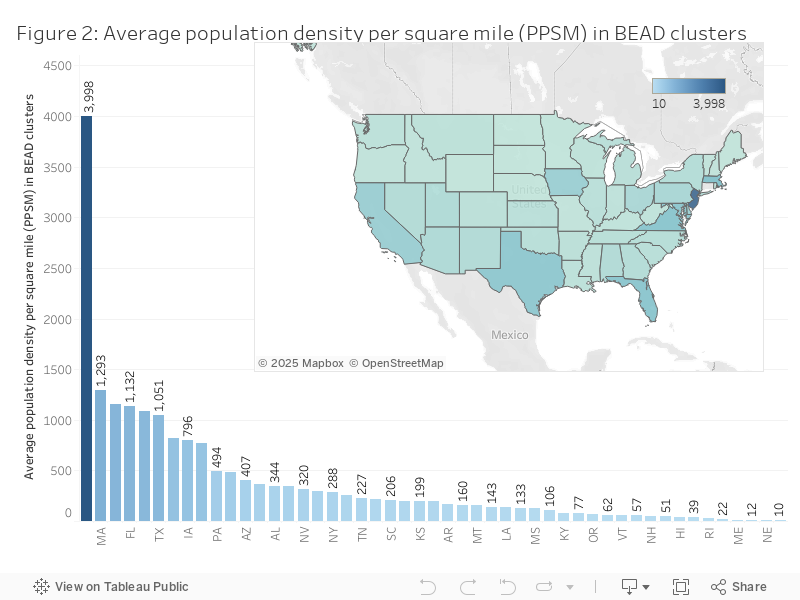
Source: FCC and Census Bureau.
How well is BEAD targeting areas with low broadband adoption?
A central goal of the BEAD program is to close gaps in residential broadband adoption through increased availability of high-speed services combined with affordable service options for eligible households. As such, an important metric for assessing program targeting is given by baseline differences in residential broadband adoption between BEAD clusters and other block groups. In other words, to what extent are BEAD state plans targeting areas lagging in residential broadband adoption?
Overall, the rate of residential broadband adoption (regardless of technology) in BEAD clusters is 82.4%, a few points below the 89.1% observed in the rest of block groups. This difference becomes significantly larger, however, when considering high-speed residential adoption, narrowly defined by the Census Bureau as having cable, DSL or fiber-to-the-home service. Nationwide, high-speed broadband in BEAD clusters stands at 47.5%, far below the rest of block groups at 73.6%. This is not surprising given that, by program rules, BEAD eligibility hinges on the availability of “reliable broadband” at minimum speeds, with mobile broadband explicitly excluded from the definition of reliable broadband.[6]
Baseline differences in residential adoption between BEAD clusters and other block groups vary widely across states. In terms of overall residential adoption (regardless of technology), we observe absolute differences that range from 36 percentage points in North Dakota to less than 6 points in about half of the states. Aside from Delaware (which has unique characteristics as a small urbanized state), other states such as Montana and in particular Massachusetts – where residential adoption is higher in BEAD clusters by about 4.5 points – raise significant questions about appropriate program targeting (Figure 3).
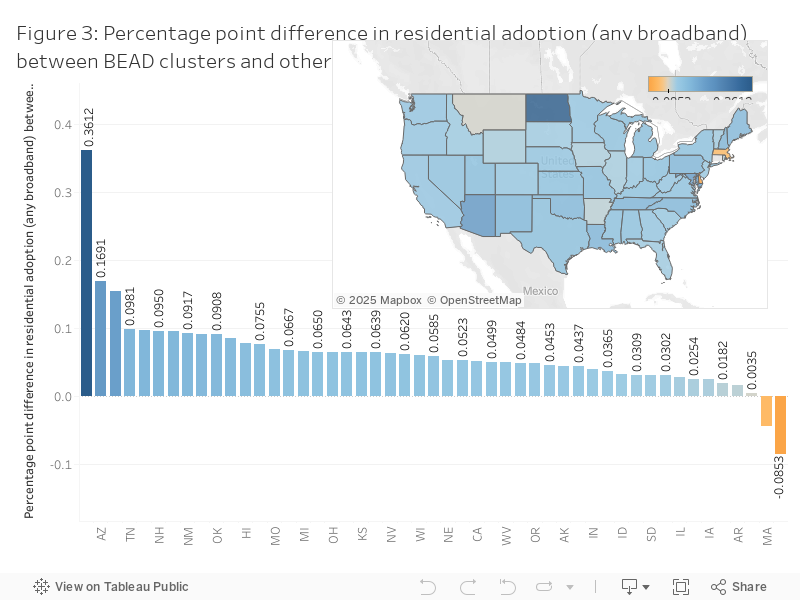
Source: NTIA and Census Bureau.
Turning now to differences in high-speed broadband adoption (cable, DSL or fiber), the results generally indicate appropriate targeting of BEAD plans towards areas with low adoption rates. It is also worth noting that absolute differences between BEAD clusters and other areas are much larger than in the case of any broadband service (discussed above). However, significant differences remain between states such as Maryland and North Dakota, where high-speed adoption rates in BEAD clusters are about four times lower than in other block groups, and states like Massachusetts where the observed adoption rate remains slightly higher in BEAD clusters relative to other areas (Figure 4).
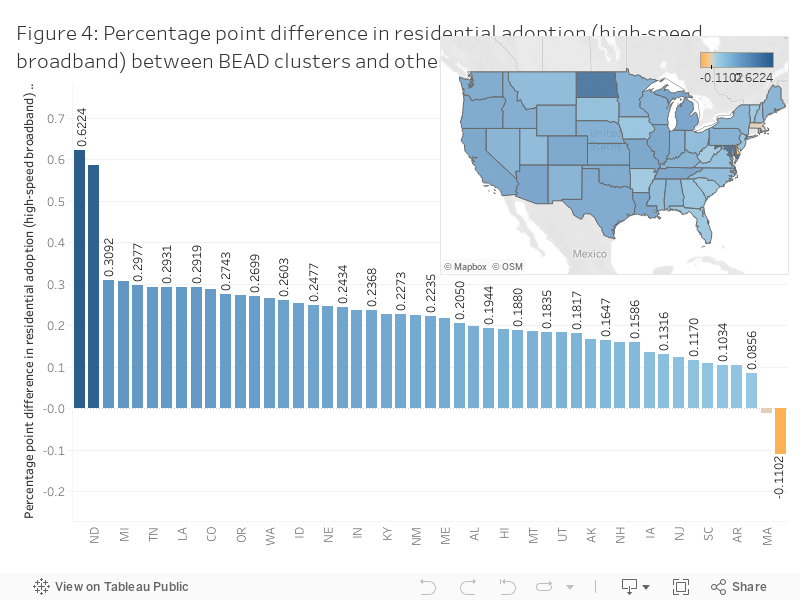
Source: NTIA and Census Bureau.
How well is BEAD targeting high-poverty areas?
One of the BEAD program’s mandate is to reduce income disparities in broadband adoption by directing funding to high-poverty areas. Therefore, another important metric for assessing program targeting is given by baseline income differences between BEAD clusters and other areas. Income levels are a critical factor for the economic viability of BEAD-funded networks, and must therefore be carefully considered in the design and implementation of BEAD plans, including the low-cost service options mandated by the IIJA.
As shown in Figure 5, median household incomes in BEAD clusters tend to be lower than those in other block groups.[7] At approximately $74,091 (in 2023 dollars), the median household income in BEAD clusters is almost 20% lower than in other block groups. This suggests that, on average, priority BEAD areas are poorer, a result that aligns with the program’s goal of closing the income gap in residential broadband adoption.
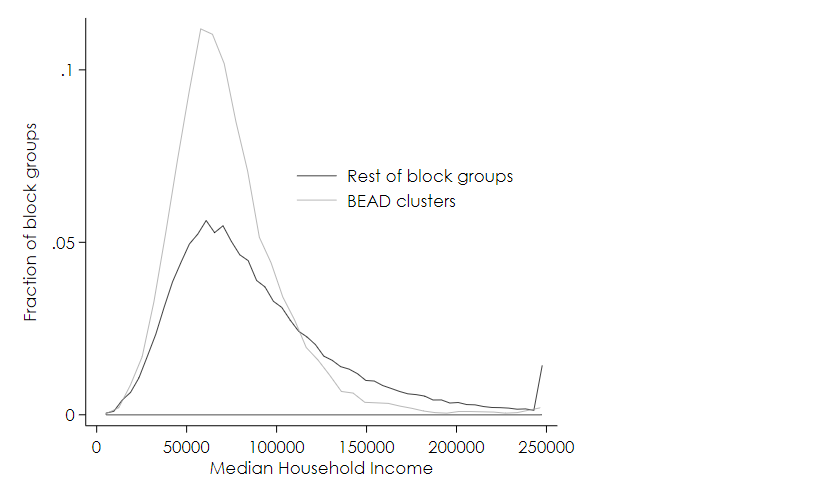
Figure 5: Distribution of median HH income for BEAD clusters and rest of block groups. Source: NTIA and Census Bureau.
Median household income in BEAD clusters varies widely across states, depending on overall state wealth as well as the characteristics of BEAD-eligible locations (Figure 6).
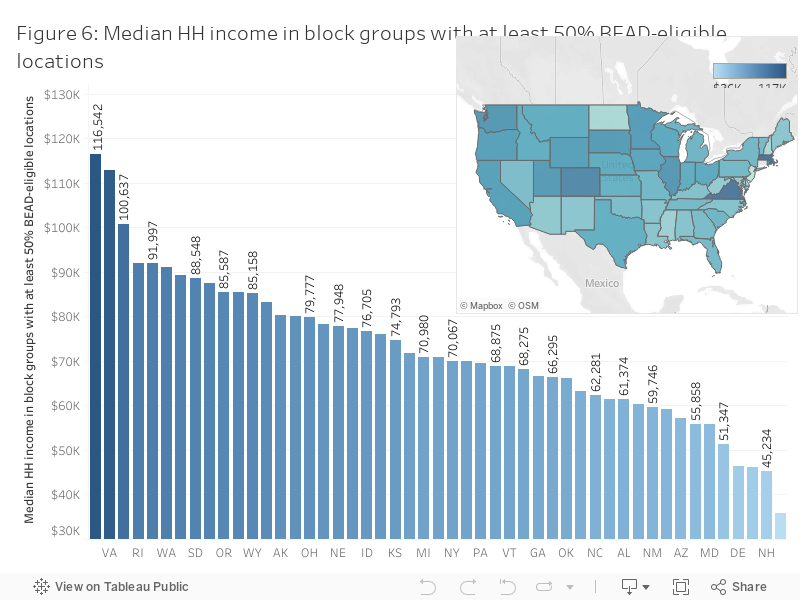
Source: NTIA and Census Bureau.
There is also variation in baseline differences in median household income between BEAD clusters and other block groups across states. This metric is a good approximation of the extent to which states are directing resources to lower-income areas. Results suggest appropriate targeting in most but not all states. In particular, they raise concerns about poor program targeting in a number of states including Iowa, Montana, Wyoming, Virginia and South Dakota, where median incomes are higher in BEAD clusters than in other block groups (Figure 7).
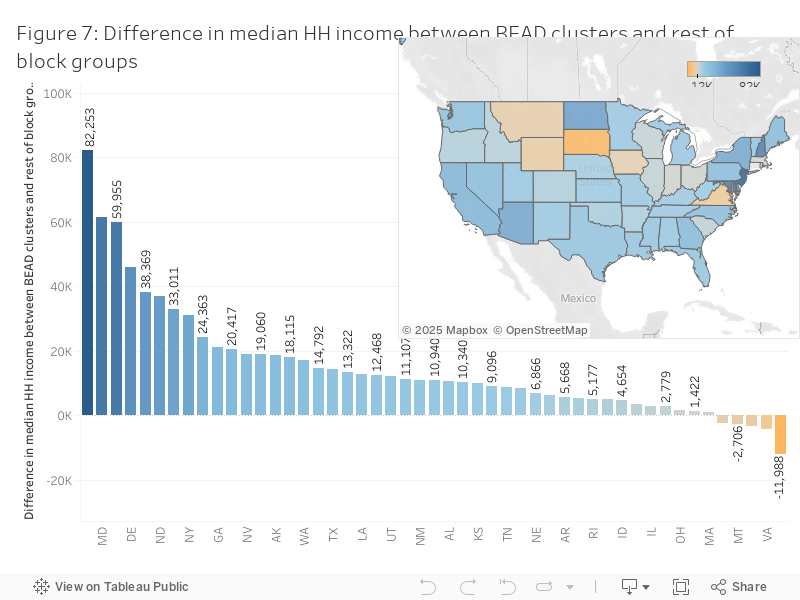
Source: NTIA and Census Bureau.
Finally, we examine the share of households in BEAD clusters whose income fall below 200% of the Federal Poverty Line (FPL). This is another important indicator of program targeting, for many state plans have established this income threshold for eligibility to low-cost service options (mirroring the guidelines of the now discontinued Affordable Connectivity Program). There is evidence of appropriate targeting in many states including New Jersey, Arizona and Mississippi, where over 45% of households in BEAD clusters are at or below 200% of the FPL. Conversely, fewer than 20% of households fall below this threshold in Massachusetts and North Dakota (Figure 8). While in some cases this simply reflects higher median incomes than the national average (e.g., Massachusetts), in other cases it raises questions about appropriate program targeting to high-poverty areas.
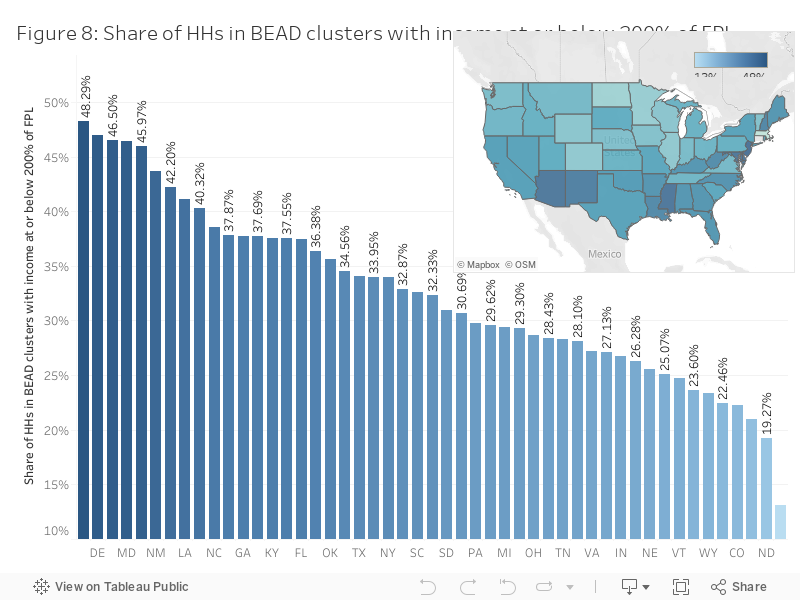
Source: NTIA and Census Bureau.
Which demographic characteristics are more strongly associated with BEAD clusters?
In order to examine this question, we create two regression models to predict whether a block group falls within our definition of a BEAD cluster conditional on a set of demographic characteristics including education, age, race/ethnicity, employment and poverty levels (see table A1 for full model results). The two models are identical except that in model 1 the share of households with any broadband service is used as a predictor, while in model 2 the share of households with high-speed broadband is used as a predictor.
As expected, population density is one the strongest predictors, with the probability of being flagged as a BEAD cluster (holding other variables constant) dropping sharply as density increases (Figure 9). The probability also drops as education (share of population with bachelor’s degree or higher) and labor force participation increases. Conversely, the predicted probability increases with the share of White-only residents in the block group but is unaffected by the share of Hispanic population or the share of foreign-born residents.
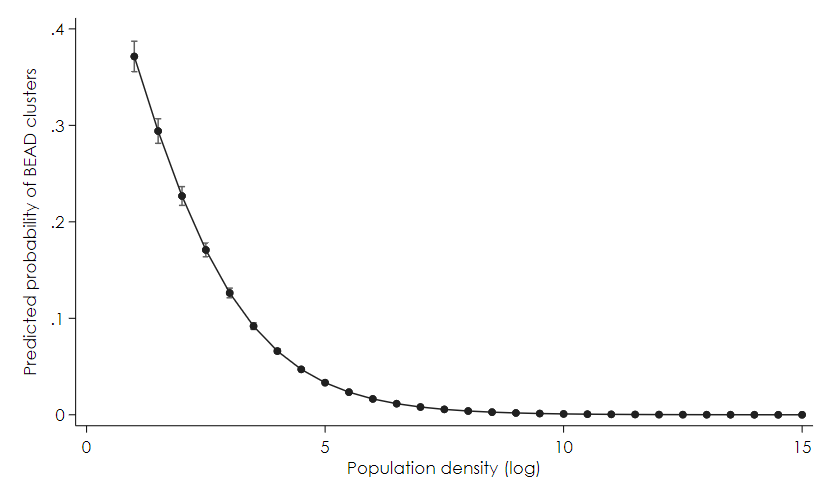
Figure 9: Probability of census block group having at least 50% of locations BEAD eligible, over (log) population density (model 1).
Further, the results validate the finding that the rate of high-speed broadband adoption is a key factor in program targeting. As shown in Figure 10, the share of households with any broadband service is a significant but somewhat weak predictor for being flagged as a BEAD cluster. By contrast, the share of residential high-speed adoption is a very strong predictor, with the figure showing a steep probability curve that drops sharply as high-speed broadband adoption grows.
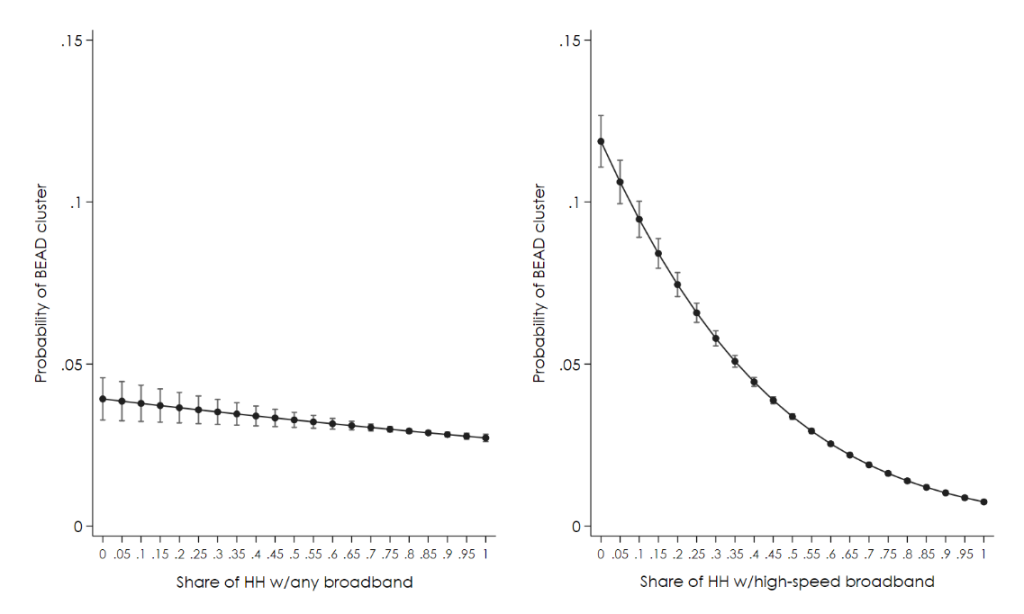
Figure 10: Probability of census block group having at least 50% of locations BEAD eligible, over share of broadband adoption.
The most notable finding from the regression models is that the share of households below the federal poverty line is not a significant predictor in model 1 (which uses any broadband adoption as predictor) and a somewhat weak predictor in model 2 (using high-speed broadband adoption as predictor). Furthermore, contrary to expectations, the probability of a census block group being classified as a BEAD cluster in model 2 decreases as the share of households in poverty increases (Figure 11). In other words, once population density, broadband adoption and other area demographics are factored in, block groups with a higher share of households below the FPL are less likely to have a high concentration of BEAD-eligible locations as designated in state plans.
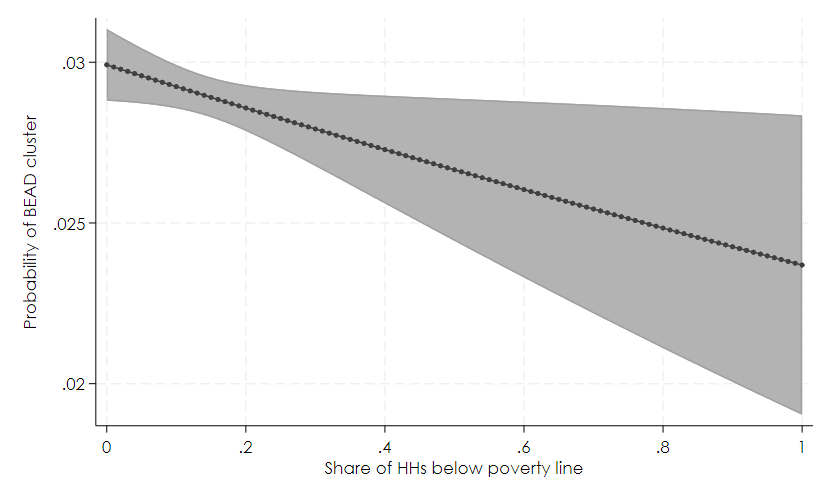
Figure 11: Probability of census block group having at least 50% of locations BEAD eligible, over share of HHs below FPL (model 2).
Key takeaways
The BEAD program offers states a unique opportunity to address enduring gaps in high-speed broadband access. The program allows significant flexibility for each state to establish priorities and select grantees, recognizing that the drivers and characteristics of such gaps depend on local factors. While the roll-out of the program has been delayed by lapses in coordination between NTIA and state policymakers, BEAD retains bipartisan support and is on track to begin disbursing funds in early 2025.[8]
As a matter of first principles, appropriate program targeting is critical to ensure that BEAD funding primarily reaches the areas and residents in most need of support for high-speed broadband access. State policymakers will also need to factor in the end of the Affordable Connectivity Program (ACP), a key complement to BEAD that provided direct support for service subscriptions to a broad group of eligible households.[9] The absence of ACP support weakens service demand among low-income households and thus raises concerns about the long-term financial viability of BEAD-supported networks. The large number of defaults in the FCC’s Rural Digital Opportunity Fund (RDOF) program, a comparable program designed to connect rural locations through reverse auction bidding, provides a cautionary note worth heeding.[10]
Based on the demographic analysis of BSLs preliminary designated by states as eligible to receive BEAD funding, we find that BEAD will primarily benefit low population density areas where adoption of high-speed broadband is lagging, with limited expected impacts in other areas. A particularly important finding is that, after controlling for other demographic factors, the share of households in poverty is not correlated with priority BEAD areas in plans submitted to the NTIA. In fact, in one model specification, the probability of classification as a BEAD cluster falls as poverty levels increase. This finding raises concerns about whether BEAD will meet its mandate of reducing income-based disparities in high-speed broadband access. At the same time, the findings also point to vast differences in program targeting across states, suggesting that these impacts will be highly dependent on local contexts.
It is worth recalling the limitations of the analysis presented above. First, eligible locations will not necessarily receive BEAD funding. Rather, they represent the universe of locations from which network operators will selectively submit funding bids to state policymakers. Further, our data predates the BEAD challenge process, and preliminary analysis suggests major adjustments to location eligibility in some but not all states following the challenge process. This is an issue we address in a forthcoming policy brief.
Overall, these preliminary findings call for continued monitoring of the demographic factors that correlate with the allocation of BEAD funds. To this end, the availability of data on a timely basis and full transparency in decision-making from federal and state policymakers remain critical. Given the historic level of investment in broadband in the IIJA of 2021, it is imperative to continue promoting independent evaluations of the funding priorities and the long-terms impacts of the BEAD program.
[1] The findings are preliminary because, at the time of writing, only pre-challenge data was available for all states. For more information on the location challenge process see www.internetforall.gov/bead-challenge-process-policy.
[2] Our dataset includes all but one state and the District of Columbia (DC) but excludes U.S. territories. The exception is Connecticut, for which census block groups could not be matched with BSL data identifiers from CostQuest.
[3] Census block groups are statistical subdivisions that generally contain between 600 and 3,000 people and are the smallest geographic area for which the Census Bureau collects demographic data. This analysis uses the most recent 5-year American Community Survey (2019-2023).
[4] A broadband serviceable location (BSL) refers to “a business or residential location in the United States at which mass-market fixed broadband Internet access service is, or can be, installed” (see FCC note on BSLs).
[5] For population density data and ranks see Census Bureau data summary.
[6] “Reliable Broadband Service is broadband service that the FCC Broadband DATA Maps show is accessible to a location via: (i) fiber-optic technology; (ii) Cable Modem/ Hybrid fiber-coaxial technology; (iii) digital subscriber line (DSL) technology; or (iv) terrestrial fixed wireless technology utilizing entirely licensed spectrum or using a hybrid of licensed and unlicensed spectrum” (NOFO Section I.C.u).
[7] The spike at the higher end of the distribution is an artifact of the fact that income data in the ACS is capped at $250,000 or above.
[8] For a discussion about ways to improve coordination and expedite funding see De Wit (2025), “4 Ways to Improve and Accelerate Broadband Expansion Nationwide” (February 13, 2025). Available at https://www.pewtrusts.org/en/research-and-analysis/articles/2025/02/13/4-ways-to-improve-and-accelerate-broadband-expansion-nationwide.
[9] An extensive analysis of the ACP program can be found at https://arnicusc.org/research/media.
[10] See “New Dataset Reveals Impact of RDOF Defaults on Each State,” Benton Institute for Broadband and Society, February 18, 2025. Available at https://www.benton.org/blog/new-dataset-reveals-impact-rdof-defaults-each-state.