ACP by State Senate Representation: Participation, Claims, Distribution by Party
How are ACP Benefits Distributed Across Party Lines?
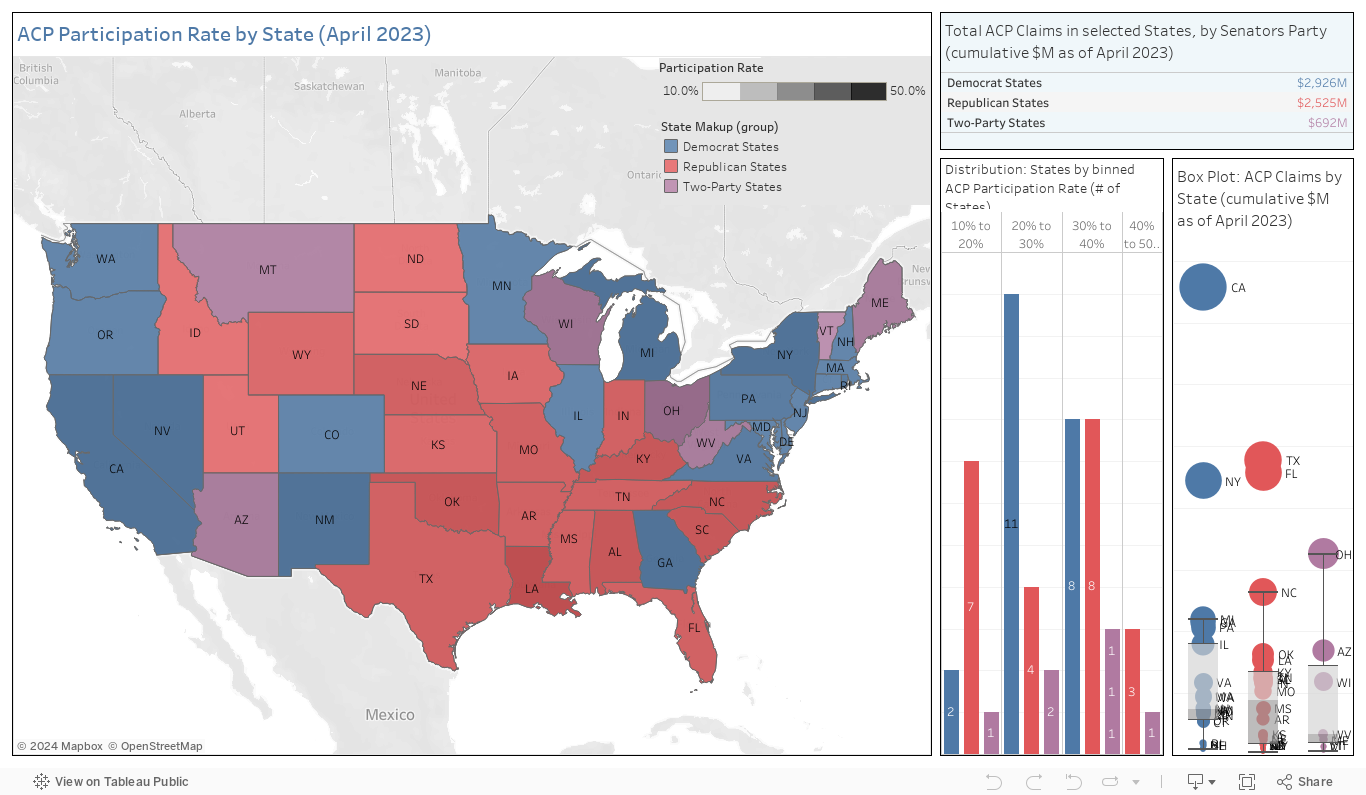
Use this dashboard to explore ACP participation (in percentage as of April 2023) and ACP claims (in cumulative USD up to April 2023), by State.
Navigation tips: to see details, hover over individual State on the map, the box plot, or the distribution chart; select a State, or a group of them, and the Total Claims result will adjust to show the total amount for the selected States.
For more details: see our blog post on Broadband for all: The Affordable Connectivity Program (ACP) benefits households across party lines
Sources: ARNIC analysis based on data from USAC ACP Tracker, Census American Community Survey and Congress.gov
Acknowledgements: this research is supported in part by a grant from the Pew Charitable Trusts Broadband Access Initiative