Broadband for all: The Affordable Connectivity Program (ACP) benefits households across party lines
Discussions about funding for social programs are too often framed along predictable partisan lines. However, the reality on the ground is frequently more complex, and the Affordable Connectivity Program (ACP) is no exception. A simple look at the data reveals that the program supports connectivity for families in both red and blue communities, and that Republicans stand to lose as much as Democrats if the program is not renewed when the funds ran out sometime in 2024.
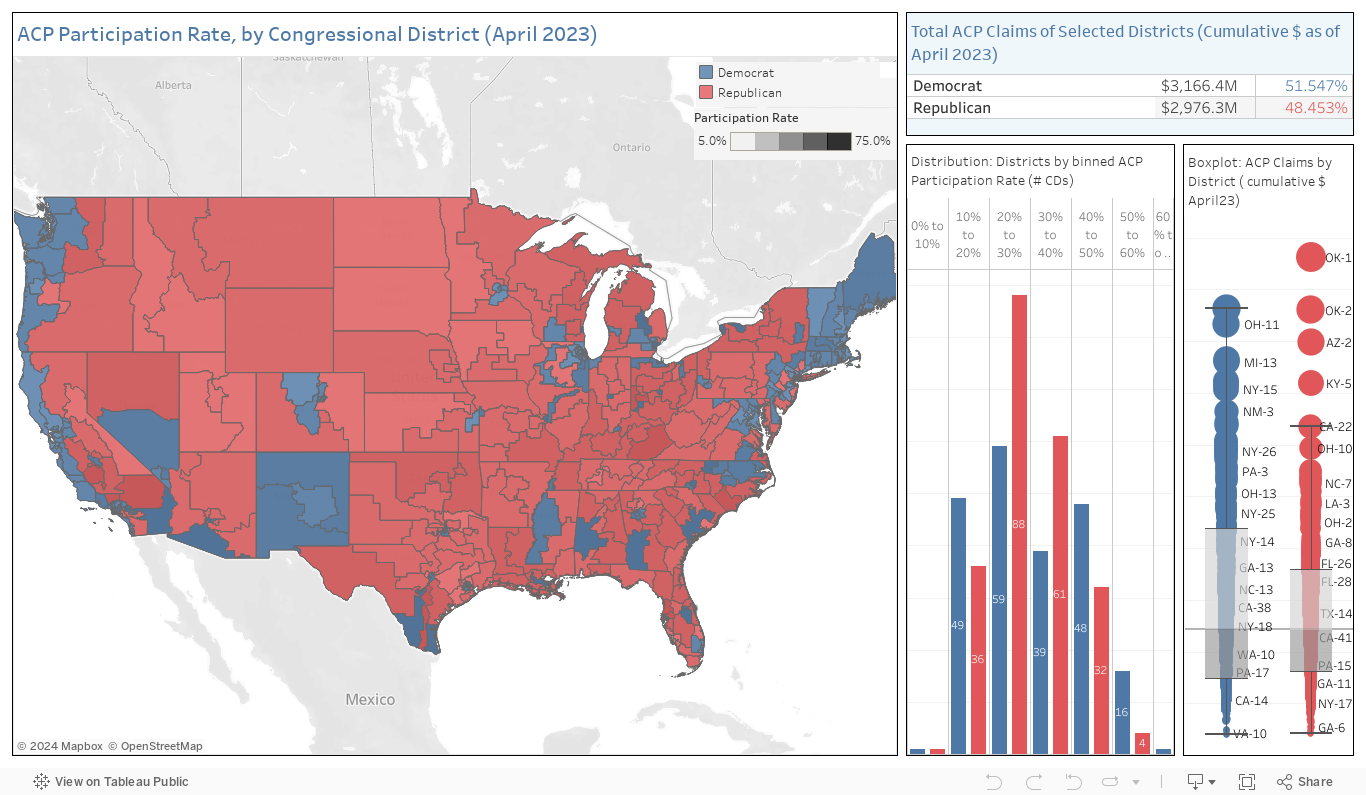
Let’s start with a simple count of recipients by congressional district. Of the approximately 17.1M households that received ACP support as of April 2023 (the latest disaggregated data available), about 8.4M lived in Republican districts while 8.7M lived in Democrat districts. In other words, the partisan split based on area of residence (49% in Republican districts and 51% in Democrat districts) indicates that House members from both parties represent almost equal numbers of ACP recipients.
Now let’s look at the participation rate (that is, enrolled households divided by eligible households) by congressional district. First, note that our participation rate estimates are slightly different from others (and, we believe, more accurate) because of the way we estimate the number of ACP-eligible households (see why here) and because of differences in how the data is “crosswalked” from the zipcode to the congressional district level (all our scripts will be made available in our github page shortly).
The results show ACP participation is only slightly higher in Democrat (31.8% of eligible households) than in Republican districts (29.7%). Even when adjusting for congressional district population, the difference remains small. Of course we don’t know the exact voting preferences of ACP households in each district, but what the aggregate data shows is that House members on both sides of the aisle are equally likely to face voter backlash if the program is not renewed.
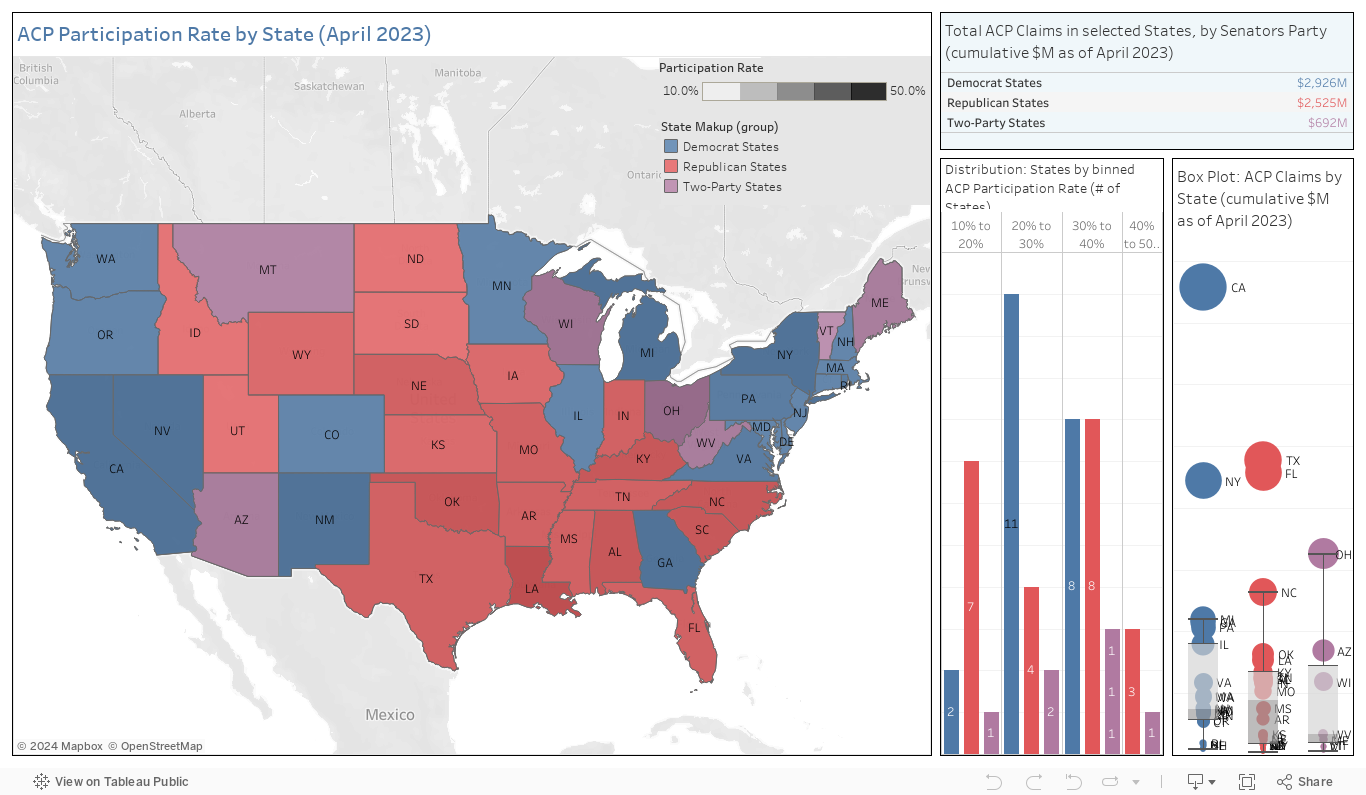
Moving now to the Senate, let’s look at the numbers by state (ignoring for a moment U.S. territories that lack Senate representation). We classify states based on the party affiliation of their senators (ignoring independents), and therefore double-count four states with mixed party Senate representation (Montana, Ohio, West Virginia and Wisconsin). For this analysis, we can use the more recent (June 2023) state-level numbers provided by USAC.
The results indicate that about 11.4M ACP households are located in states with at least one Republican senator, with about 10.4M in states with at least one Democrat senator (again, this total exceeds the total number of ACP households because we are double-counting 4 states with bipartisan Senate representation). Further, the participation rate is almost identical in Republican (31.2% of eligible households) and Democrat states (30.8%). Notably, of the 10 states with the highest ACP participation rates, 4 are red and 5 are blue, while Ohio (the state with the highest participation rate) has one senator from each party. Again, an almost equal split along party lines.
Finally, looking at the total amount of ACP funding that has gone to households in each state since the start of the program in January 2022 reveals a similar picture (once again, remember we are double-counting the 4 states with mixed-party Senate representation). Perhaps contrary to expectations, slightly more funding has gone to households in Republican states (about $3.8B) than to households in Democrat states (about $3.5B). A similar analysis by ILSR confirms that funding has gone almost equally to households in Republican and Democrat congressional districts. These facts help explain the bipartisan support for the program found in voter surveys.
Summing up: the ACP program is providing support to households in both red and blue states and congressional districts, helping vulnerable families afford a service that connects them to jobs, education and health services, among many other uses of broadband. Should congress fail to renew funding for the program, there will be millions of dissatisfied voters on both sides of the aisle.
The two dashboards below show ACP participation (in percentage as of April 2023) and ACP claims (in cumulative USD up to April 2023), by congressional district and by state. Navigation tips: to see details, hover over individual districts or states on the map, the box plot, or the distribution chart; select a district or a state, or a group of them, and the Total Claims result will adjust to show the total amount for the selected units.