The Future of the Affordable Connectivity Program.
Blog Post #1: Analyzing the Impact of Potential Changes to the ACP Eligibility Criteria
Congress is discussing a number of different scenarios to continue funding the ACP program once the remaining funds are depleted, which is projected to happen in the first half of 2024. Several of the scenarios being considered involve changes to the current eligibility criteria. In this post – the first in a series of blog posts about the future of ACP – we examine the potential impact of lowering the household income eligibility threshold, currently set at 200% of the federal poverty line (FPL). What would happen if this threshold were lowered to 135% of the FPL? How would this affect household eligibility across states and counties, and for disadvantaged populations?
How many households would become ineligible?
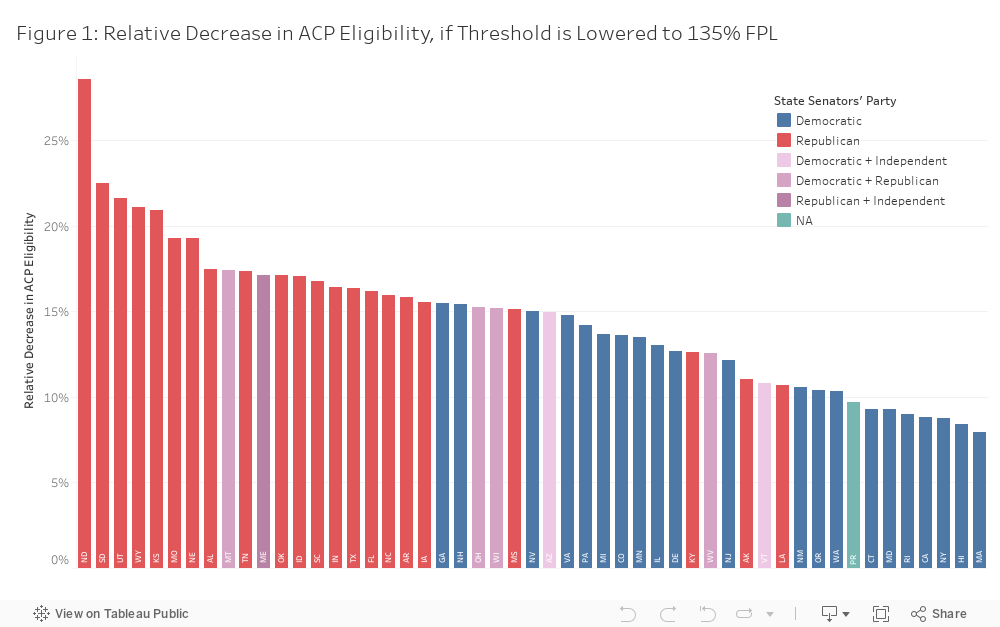
Nationwide, if the ACP income eligibility threshold were lowered to 135% of the FPL (similar to Lifeline and the EBB program that preceded ACP), about 7.4M households that currently qualify to receive ACP benefits would become ineligible. This represents a decrease of 13.6% from the current number of eligible households (about 54.1M). However, the impact varies widely across states (Figure 1). In Kansas, Utah and North Dakota, this change would exclude over 20% of currently eligible households. In contrast, in Massachusetts, New York and California the relative impact would be smaller with fewer than 10% of households losing eligibility. In addition, it is worth noting that the relative impact of lowering the income threshold would be larger in states with Republican senators, even though the ACP program is benefitting red and blue states almost equally (see here for further analysis of ACP uptake by party).
Similar variations are observed at the county level (Figure 2). In absolute terms, lowering the eligibility threshold to 135% of the FPL would have the largest impact in Los Angeles County, CA, where almost 140,000 households would lose eligibility. However, this represents a modest reduction in eligibility of 8.2%. The second largest absolute drop in the number of eligible households would occur in Harris County, TX, where about 116,000 households would no longer qualify for ACP. This however represents a much larger percentage drop in eligibility of 14.7%. In relative terms, one of the largest drops in eligibility would occur in Cass County, ND (the state’s largest), where almost 1 in 3 currently eligible households would no longer qualify for ACP.
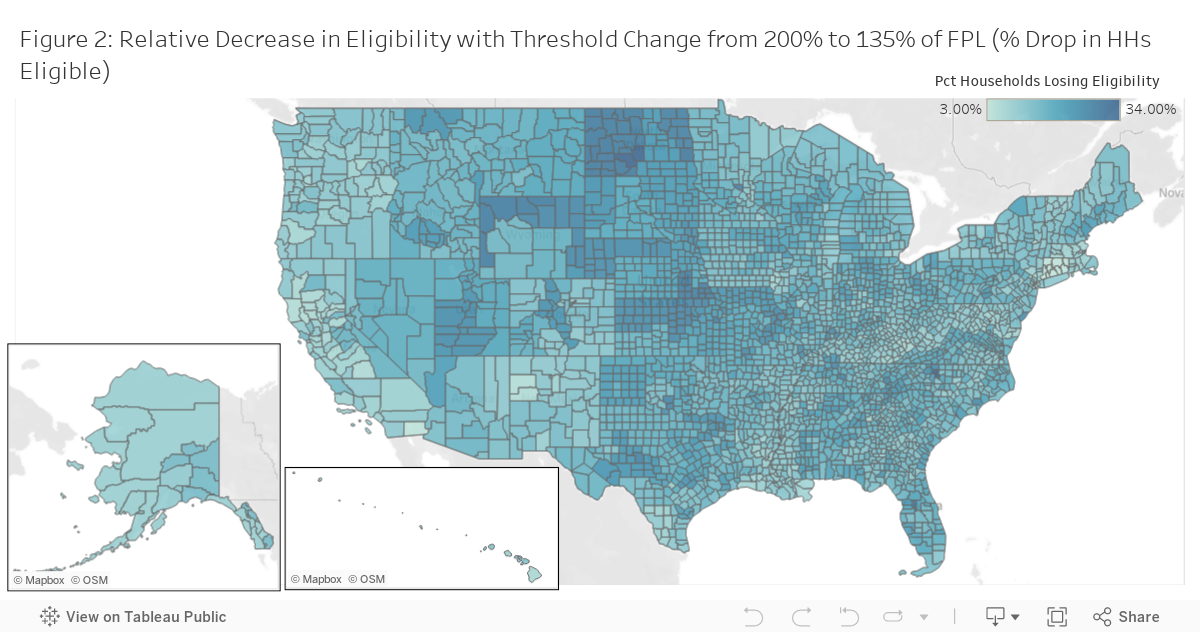
Would lowering the threshold to 135% of the FPL affect urban and rural areas differently? To answer this question, we rely on Census data that flags counties as either urban or rural as defined by the IIJA. Of the 7.4M households that would no longer qualify for ACP, about 6M are located in urban areas, with the remaining 1.4M in rural areas. The relative impact however would be larger in rural areas, where about 16% of currently eligible households would no longer qualify for ACP, compared to about 13% in urban areas.
How many households would lose ACP benefits?
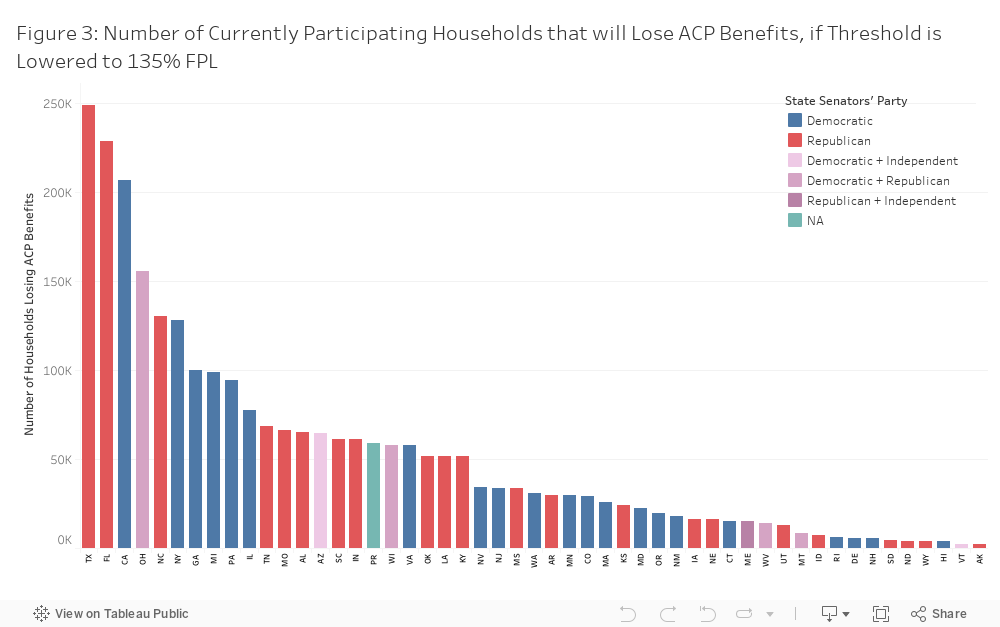
According to our estimates about 38% of eligible households are currently enrolled in ACP (for more on how we calculate participation see here). Because of incomplete participation, estimating how many households would effectively lose ACP benefits as a result of changes to the eligibility criteria requires several assumptions. Our estimate is that about 2.7M of the approximately 21M households currently enrolled in ACP would lose the benefit if the income threshold is lowered to 135% of FPL. In absolute terms, the states that would see the largest drop in beneficiaries are Texas (about 249K households), Florida (about 229K households) and California (207K households). Figure 3 presents estimates of the numbers of households likely to lose ACP benefits across states.
How would changes impact disadvantaged groups?
The Infrastructure Act of 2021 directs federal and state agencies to improve broadband access for underserved “covered populations,” defined as: (1) low-income households (at or below 150% of the FPL); (2) aging individuals (60+ years); (3) incarcerated individuals; (4) veterans; (5) individuals with disabilities; (6) individuals with a language barrier; (7) individuals who are members of a racial or ethnic minority group; and (8) individuals who primarily reside in a rural area. To examine the potential impact of changes in the ACP income eligibility threshold for these groups, we use microdata from the American Community Survey (ACS) to identify households with at least one member belonging to a “covered population” (with the exception of incarcerated individuals which are not captured in ACS data).
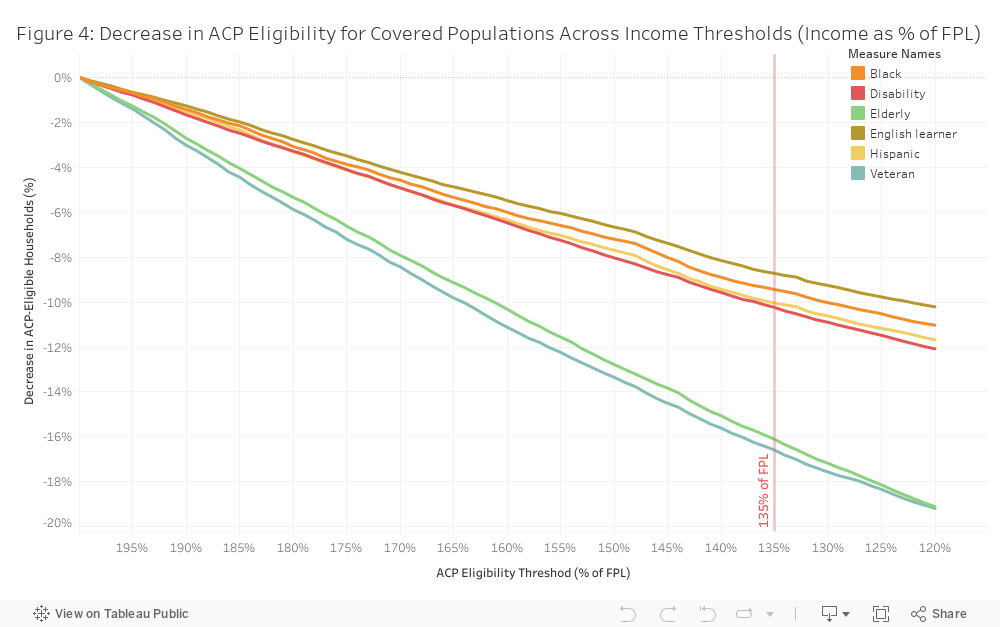
Figure 4 shows the percent drop in eligible households for each of these covered populations across a range of income thresholds, starting at 200% of the FPL (the current criteria) and ending at 120%. The evidence indicates disparate impacts across populations. In particular, reducing the threshold from 200% to 120% of the FPL would result in about 10% fewer households with linguistic barriers being eligible for ACP. By contrast, the same change would reduce eligibility among households with an aging adult by about 19%.
Key takeaways
In this first blog post on the future of the ACP program, we analyze the potential impact of changes to the income eligibility threshold. Two results stand out: 1) the impact of lowering the income threshold will be unevenly distributed across states, affecting red states significantly more in terms of percentage drop in eligible households; 2) the impact will also be unevenly distributed across populations, and affect veterans and older adults significantly more than other historically disadvantaged groups.
In the next blog post, we will analyze the impact of potential changes to the ACP eligibility criteria based on participation in SNAP, Medicaid and other safety net programs. In addition, we will present a web tool that uses ACS microdata to estimate the number of ACP eligible households using different combinations of income threshold and program-based eligibility criteria.
Note: All the above figures are interactive; mousing over a chart element will bring up more detail in a tooltip. To inspect the underlying data, click on the “tableau” logo at the bottom-left of each chart; this will open a dashboard with options to download the dataset or the visualization in various formats.
This blog post was written by Prof. Hernan Galperin and Prof. François Bar. The Pew Trust has generously provided funding for this project.